La Niña has officially been declared, which has the potential to impact global food production. In this article we delve into the historical impact of La Niña on Australian and global wheat production.
According to the BOM, ‘El Niño’s often lead to drier conditions over large parts of Australia, while La Niña’s tend to enhance rainfall over much of the continent’. However, it must be noted that not every drought is associated with El Niño nor every wet year with La Niña.
In this analysis we have examined the El Niño and La Niña events which have been considered moderate to strong from 1960 to 2015 in order to determine what impact these events have on grain crops by analysing the year on year change in wheat production.
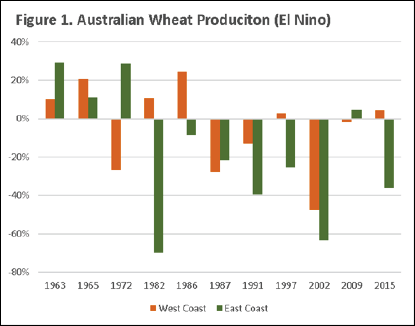
In Figure 1, we see the year-on-year impact of El Niño split into east coast and west coast. In the period 1960-2015, seven of 11 El Niño years have recorded a reduction in wheat production, with six of these years recording a > 20% reduction. In Western Australia the impact of El Niño has been less negative, with six out 11 event years recording an increase. However, only two of these years record > 20% increase. In addition, during the years of production decline, three of these years recorded large production falls of > 20%.
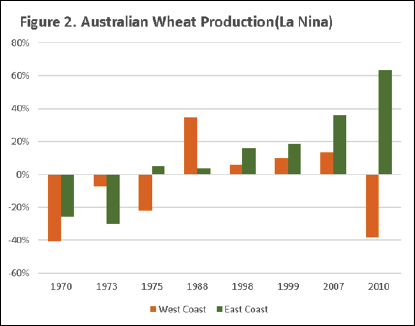
The year-on-year impact of La Niña is displayed on both the east and west coasts as highlighted in Figure 2. In the period 1960-2015, there have been eight La Niña events. The east coast during these La Niña events experienced six years where production has been higher, with four being > 15% and two events where production reduced by > 20%.
The impact of La Niña in WA has caused four out of eight years to have a production contraction, with three of those years having a > 20% decline. The La Niña years with an increase in production in WA have resulted in smaller increases than the east coast with the exception of 1988.
In both Figures 1 and 2, it is evident that since the mid 1980s in Australia El Niño events have overall been negative for crop production and La Niña events have been positive, with the exception of 2010 in WA.
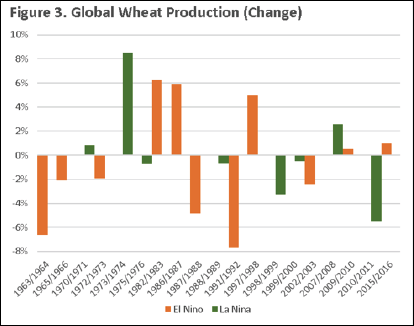
In Figure 3, the year-on-year impact of La Niña and El Niño is detailed at a global level. During an El Niño year we can determine that production was reduced in six years out of 11, and increased in five years with no changes of more than 10% on a global level.
During La Niña years, global production has increased in three out of eight years, whilst production has decreased in five years. At present, the market is not yet overly concerned with La Niña. However, it does have the potential to impact greatly on the US crop through drier weather and eastern Australia through wetter than average conditions. If La Niña starts to impact on the US crop production, then we are likely to see risk premiums emerge in US futures markets, which will flow on to our own prices.
[key_points]What does this mean?
The market is looking for information to provide direction. The anxiety resulting from the potential for a La Niña can result in the formation of a risk premium in Chicago futures, as buyers seek to reduce risk from US related supply issues.
Australian growers would therefore benefit from a rise in futures prices.
Mecardo is Australia’s leading agricultural commodity risk management advisors and market intelligence experts. Mecardo delivers the expertise of advisors and other market intelligence experts in a concise, easy-to-read format.
It doesn’t just report the market news – Mecardo explains what’s driving the market, helps to understand what’s important and what it means for the reader.
The client base of Mecardo is spread across the agricultural landscape, including producers, processors and consumers of Australian agricultural commodities, both domestically and internationally.
For more information visit our website at www.mecardo.com.au, or contact us on ask@mecardo.com.au

